

![]()
Logistik och transport
Vilka parametrar är viktiga att registrera under transport?
Känsliga varor som precisionsmaskiner, kemikalier eller elektronik utsätts för en mängd olika risker på väg till kunden. Oavsett om det är på väg, järnväg, på sjön eller i luften finns risk för kollisioner och tippning både i lastningssituationerna och på vägen till destinationen. Likaså kan ändringar i miljöförhållanden vara skadliga för det gods som transporteras. Dataloggrar använder sensorer för att övervaka olika miljöparametrar som temperatur, lufttryck, luftfuktighet, ljusförhållanden och mekaniska dynamiska belastningar som stötar och slag.
Valet av lämpliga parametrar att registrera beror på godset som ska transporteras och syftet med registreringen. Vill du mäta påfrestningarna på en vara med hjälp av falltester eller med en provsändning för att optimera förpackningen? Är det fråga om att registrera transporten i förebyggande syfte för att i ett tidigt skede upptäcka eventuella skador? Handlar det om att dokumentera en transport som pågår i veckor för att följa normer och föreskrifter?
Acceleration i form av chock och stöt räknas vara den främsta orsaken till transportskador. Data som registreras av accelerationssensorer kan användas för att klargöra ansvars- och kvalitetssäkringsfrågor. Skador är inte alltid synliga från utsidan och kommer då upptäckas först när produkten är på plats och tas i bruk. Även om det transporterade godset är försäkrat, är den försäkrade skadan ofta bara en liten del av en potentiellt mycket större totalförlust. Följdskador från felaktiga transporter, såsom förluster på grund av saknat gods, oplanerad efterproduktion, förseningar eller avbrott i driften, ska också beaktas.
Temperatur är viktig för lättförgänga eller reglerade varor såsom frysta produkter, läkemedel, organ eller blodkomponenter, måste standarder för temperatur och luftfuktighetsgränser följas och fullt ut dokumenteras under transport och lagring. Relativ luftfuktighet är nära relaterad till temperaturen via daggpunktsparametern fastställa orsaken till korrosion på metalldelar eller fukt- och mögelskador på organiskt material.
Ljus (lux) är också en viktig fysisk påverkansfaktor, till exempel för livsmedel och kemiska ämnen, eftersom solstrålning ofta har en skadlig effekt på känsliga varor. Parametern ”ljus” är dock av särskild betydelse för att upptäcka otillåten manipulation av normalt stängda behållare: Ljusinfall indikerar att behållaren har öppnats, vilket kan leda till slutsatser om en planerad eller utförd stöldhandling.
Lufttryck är också ett betydande värde som kan påverka egenskaperna hos deformerbara varor eller användas som en proxy för att garantera att en hermetisk tätning har upprätthållits. Denna parameter är särskilt viktig för flygfraktstransporter, där trycket i flygplanet kan variera kraftigt.
Hur lång tid tar transporten?
En av de viktigaste frågorna av alla. Om en transport med lastbil över en ojämn landväg som varar i veckor måste övervakas eller om sjöfrakt måste åtföljas i månader, krävs en betydligt högre lagringskapacitet och batteritid än för en kort flygtransport. Den faktiska inspelningstiden för en datalogger är beroende av dess lagringskapacitet, den inställda mäthastigheten och förinställda gränsvärden. För förbestämda parametrar kan minnesbehovet beräknas med Mätvärden/Antalet kanaler * frekvens = tid
För MSR-transportloggrar går det inte att skapa en generellt giltig formel för att beräkna inspelningslängden för chockhändelser. I chockläge beror antalet registrerade händelser på längden på chockhändelserna samt lagringskapaciteten och lagringsläget för dataloggaren.
| Modell | Batteri[mAh] | ±15 G, Mätfrekvens [1/s (Hz)] | ±200 G, Mätfrekvens [1/s (Hz)] | Mätvärden | Chockhändelser 2) | ca Mättid |
|---|---|---|---|---|---|---|
| MSR165B8 | 1000 | 100…1600 | 100…1600 | ≥ 2 m | ≥ 10’000 | up to 6 months |
| MSR165B8 & N10006 | 1000 | 100…1600 | 100…1600 | ≥ 1 bn | ≥ 5 m | up to 6 months |
| MSR165B52 | 2 x 7700 | 100…1600 | 100…1600 | ≥ 2 m | ≥ 10’000 | up to 5 years |
| MSR165B52 & N10006 | 2 x 7700 | 100…1600 | 100…1600 | ≥ 1 bn | ≥ 5 m | up to 5 years |
| MSR175B16T2AA5 | 230 | 1600 | 3200/6400 | ≥ 2 m | ≥ 1’000 | up to 8 weeks |
| MSR175B16T6H3P5AA5L2 | 230 | 1600 | 3200/6400 | ≥ 2 m | ≥ 1’000 | up to 8 weeks |
| MSR175B54T2AA5 | 7700 | 1600 | 3200/6400 | ≥ 2 m | ≥ 700 | up to 2 years |
| MSR175B54T6H3P5AA5L2 | 7700 | 1600 | 3200/6400 | ≥ 2 m | ≥ 700 | up to 2 years |
| MSR175plus1) | 4000 | 1600 | 6400 | ≥ 4 m | ≥ 1’000 | 3) |
Tabell från MSR 2023-10-10
1) Registrerar med både ±15 g och ±200 g accelerometrar.
2) Baserat på ett en typhändelse 200 ms lång med maximal samplingshastighet.
3) Med GPS aktiverat upp till 55 dagar. Utan GPS upp till 18 månader
Om fler parametrar loggas samtidigt kommer tiden reduceras.
Läs mer i om accelerationsmätning med MSR loggers i basic information on acceleration measurements.
WHAT INFORMATION DO I GET FROM THE SHOCK EVENTS?
When choosing a data logger, special attention must be paid to the evaluation software. Evaluation software must be able to process millions of data quickly. It must be easy and fast to determine relevant shock events, and it must be possible to examine and export the data curves or measuring points of each individual shock.
In the case of a shock, for example, it is often not sufficient to know the peak value for the acceleration; rather, the associated duration of the shock is equally relevant, as this can be used to determine the intensity of the shock directly or in comparison to other shocks on the object. Two impacts with the same intensity can have different effects on the object, as the absolute values for impact duration and acceleration always determine the effect on the object.
In the MSR ShockViewer software supplied with the MSR165, MSR175 and MSR175plus acceleration data loggers, it is possible to filter shock events with the aid of the values for intensity (IoT) and pulse time (Tot) in order to concentrate on the most serious events in the analysis. possible. Spectral analysis data of a selected shock event can also be displayed and exported either in a table or in a diagram. Several types of spectral analyses (e.g. Magnitude, Power Spec, etc.) and several types of weighting windows (e.g. Rectangle, Gauss, Hamming, etc.) are available.
DO I WANT TO BE ABLE TO RECORD VIBRATIONS AS WELL AS SHOCK EVENTS WITH THE DATA LOGGER?
Vibration measurement with data logger MSR165
If you also want to use your data logger for vibration measurements, we recommend the MSR165 data logger. In addition to recordings in shock mode, the MSR165 can also permanently record vibrations. In order to be able to correctly record vibrations with the help of acceleration sensors, appropriately high measuring rates suitable for the vibration must be selected for the measurements. Due to the large amount of data, the duration of the recording is limited. You can increase the storage capacity of the MSR165 (standard ≥ 2 million measured values) to over 1 billion measured values with a microSD card.
In the following *table you can see the approximate duration for the two data logger versions MSR165B8 (LiPo battery 1000 mAh), and MSR165B52 (Li-SOCl2 batteries 3.6 V, 2 x 7700 mAh), depending on the sampling rate.
| MEASUREMENT RATE | DATA LOGGER MSR165 | |||
| MSR165B8 | MSR165B52 | |||
| MEMORY | LiPo-BATTERY | MEMORY | Li-SOCl2-BATTERY | |
| 25 Hz | 15 hours | 23 days | 15 hours | 354 days |
| 50 Hz | 7 hours | 12 days | 7 hours | 184 days |
| 100 Hz | 3 hours | 5 days | 3 hours | 77 days |
| 200 Hz | 113 min. | 3 days | 113 min. | 46 days |
| 400 Hz | 56 min. | 40 hours | 56 min. | 26 days |
| 800 Hz | 28 min. | 20 hours | 28 min. | 13 days |
| 1600 Hz | 14 min. | 10 hours | 14 min. | 6.5 days |
Additional recordings such as climate values (temperature, humidity, air pressure, light) reduce the measurement time.
For further information, please refer to our basic information on acceleration measurements.
*Table as of March 2023, subject to change and/or error.
WHAT SAMPLING RATE DO I NEED FOR MY MEASUREMENT TASK? DOES IT HAVE TO BE FREELY ADJUSTABLE?
The sampling or measuring rate is the number of g-value measurements per unit of time (usually per second – unit Hz). The measuring rate determines the accuracy of the recording of the acceleration event. The higher the measuring rate, the finer the actual course of an acceleration event can be resolved. In order to be able to precisely record transport loads, it has been shown that a data logger should record well over 10,000 times per second in order to be able to map the g-value curves well. Of course, this should be done in three geometric space axes (x, y, z) in order to obtain acceleration values in all directions.
The disadvantage of high measurement rates is that there is a very high volume of data, so that the memory and performance limits of the logger may be reached quickly. The continuous measurement and processing or storage of the data also entails high power consumption, which limits the mobile operating times of the logger. With an event-based measurement, it is possible to record specific impacts that exceed a critical duration and/or strength. In addition to the improved clarity of long-term measurements, this also offers the advantage that only relevant events are recorded and thus energy and storage capacity are used more effectively.
Set thresholds
If the focus of the measurement task is not on short-term shock analyses but on long-term monitoring, threshold values can be set to record specific shocks that exceed a certain preset g-value (Threshold) and a minimum shock duration (ToT). This procedure saves storage capacity, as only relevant events are stored. In this case, it makes sense to also store some g-values that lie before and after the event in order to be able to evaluate the data for the entire event. With MSR transport data loggers, 32 measuring points per axis before the event and 100 measuring points per axis after the event are automatically saved.
Information on the MSR transport data loggers
| DATA LOGGER | MEASUREMENT/STORAGE RATE |
|---|---|
| MSR165 | The measuring rate can be set between 25 Hz and 1600 Hz or can be omitted altogether (e.g. if permanent recording is required for vibration measurements). |
| MSR175 | 3 shock measurement modes: either ±200 g at 6400 Hz or ±200 g at 3200 Hz or ±15 g at 1600 Hz |
| MSR175plus |
Shock measurement mode: simultaneous measurement ±200 g at 6400 Hz and ±15 g at 1600 Hz |
DO I NEED A GPS TRACKER?
If you want to know and, if necessary, prove where your transport goods have been and for how long, then a data logger such as the MSR175plus with GPS tracking can be helpful, because the recorded data can be used to quickly locate critical transport events.
Like a «black box», the MSR175plus data logger records problematic events such as impacts, shocks, temperature overshoots or undershoots or unacceptable humidity levels and records their geographical position with GPS and a time stamp. The logger is equipped with a GPS/GNSS (Global Navigation Satellite System) receiver, which allows it to record the satellite-based position data.
IS THE DATA LOGGER APPROVED FOR TRANSPORT BY AIR FREIGHT?
All data loggers containing lithium polymer batteries are subject to certain IATA (International Air Transport Association) regulations when transported by air. MSR transport data loggers comply with stricter aviation safety conditions.
Why is it meaningful to record acceleration?
Measuring physical impacts is of great importance in many fields of application in order to obtain information on mechanical loads and the stresses on objects such as goods, merchandise, workpieces, parts etc.
 The causative loads, which have arisen as a result of external influences, are to be regarded as largely independent from the examined object. In contrast, the resulting stresses impacting on the object are directly dependent on the examined object and can only be described with reference to the specific object.
An important parameter for evaluating impacting stresses is the dynamic mechanical load, i.e. the chronological sequence of the acceleration impacting on the object. It can be appropriately measured by means of acceleration sensors of different designs and grades, as well as recorded for further analysis, using data memories.
These sensors are, for example, used for transportation monitoring, fault diagnoses and load tests.
What is an acceleration data logger?
An acceleration data logger is an automatic recording and measuring device, which autonomously records stochastic shocks or vibrations over a specific period of time in the form of unbiased raw data. Once recorded, the shock and vibration data can be retrieved, viewed and analysed.
The processor in the data logger processes the measured data and saves it to the storage medium together with the respective measurement periods. This means that the data can be retrieved after measuring has taken place, either directly on the logger or via a computer port. Software illustrates the measured data in tables or charts and provides functions for analysing the measured data. A popular analysis method is the acceleration-time chart with DBC (Damage Boundary Curve).
The shock and vibration data can also be recorded based on events that meet specific criteria. With an event-based measurement, you can specifically record shocks that exceed a critical time period or magnitude. In addition to providing better clarity for long-term measurements, this has the benefit that only relevant events are recorded and therefore energy and storage capacity are used more effectively
Acceleration data loggers usually use non-volatile storage media to save the measured data. Therefore the measured data is preserved, even if the power supply fails.
[Source: Excerpts from Wikipedia, amended by MSR Electronics GmbH]
For more detailed information on the measurement and evaluation of dynamic mechanical loads, such as transportation monitoring by means of automated recording devices for measuring stochastic shocks, please refer to DIN EN 15433-6, for example.
Mounting instructions for MSR shock and vibration data loggers
The data loggers should be force-fitted as close as possible to or on the object to be monitored. Fastening to the packaging or the means of transport will lead to deviating results.
Screw the data loggers to the object at the holes provided. Alternatively, the data loggers can also be fastened with high-strength industrial adhesive tape or cable ties. Magnetic fastening should be avoided. It only acts in the direction of the magnetic field lines – is not force-locking.
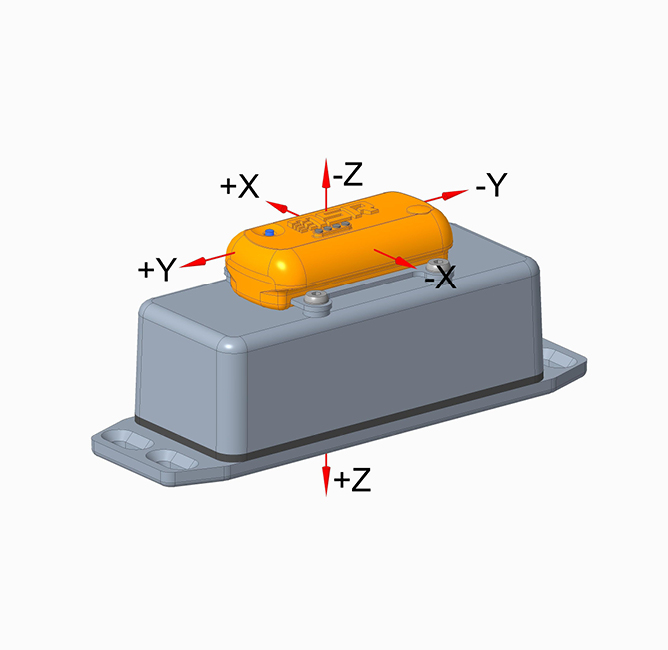
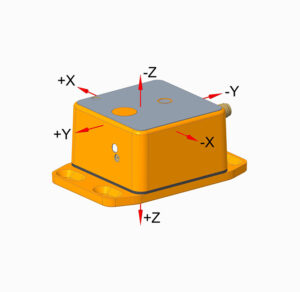
Orientation
Align the axes of the data loggers with the main directions of movement. The data loggers can be mounted in any position. Make a note of the position and direction of the axes for later evaluation.
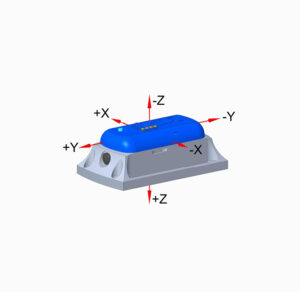
- MSR165 B7/B8


- MSR175 B16
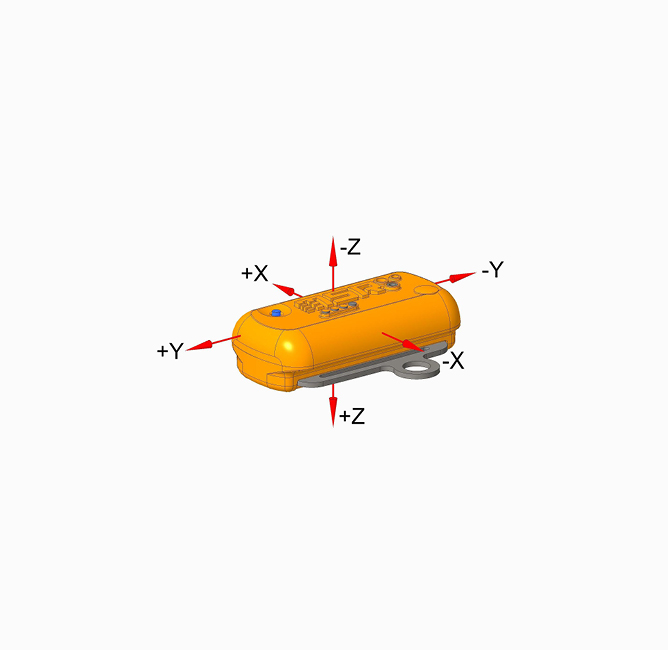

- MSR165 B52
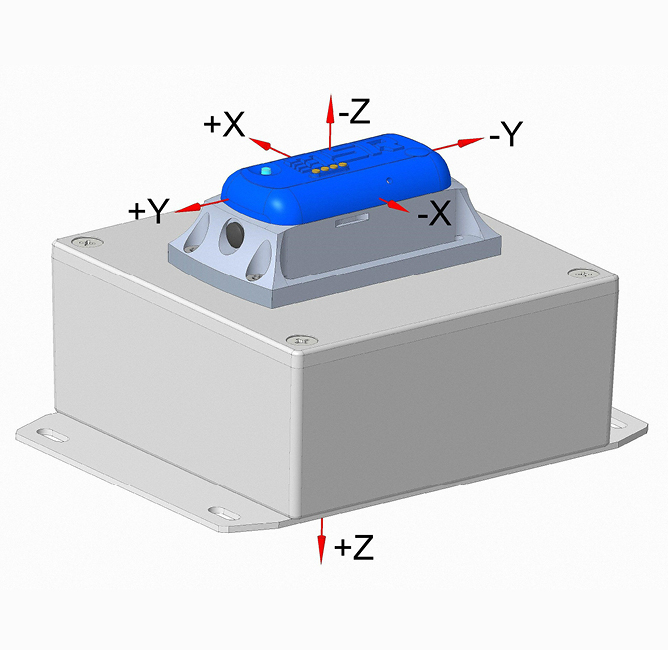
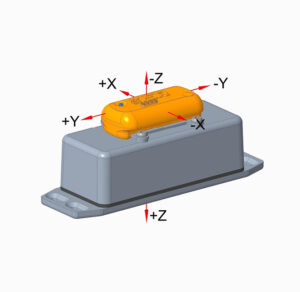
- MSR175 B54
- MSR175plus B56

Determination of the slope
The ±15 sensor additionally measures gravity (direction to the center of the earth ≈ 1g). Due to the static position, the inclination can also be determined.
Example 0…±180°: ACCx = -0.518g, ACCy=0.425g, ACCz=0.741g:
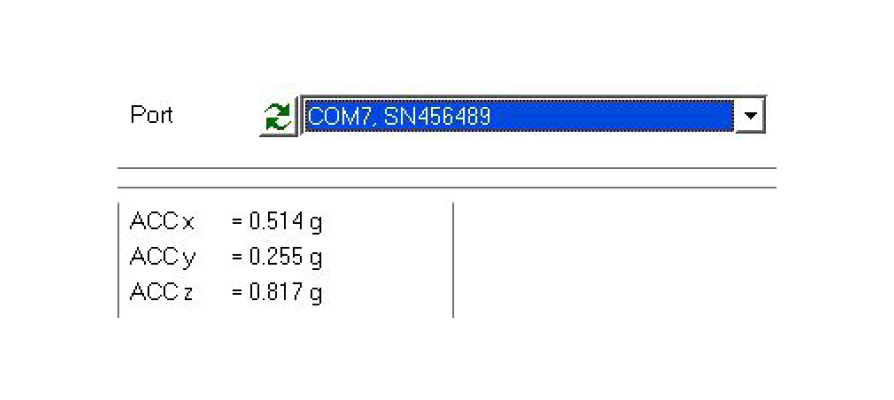
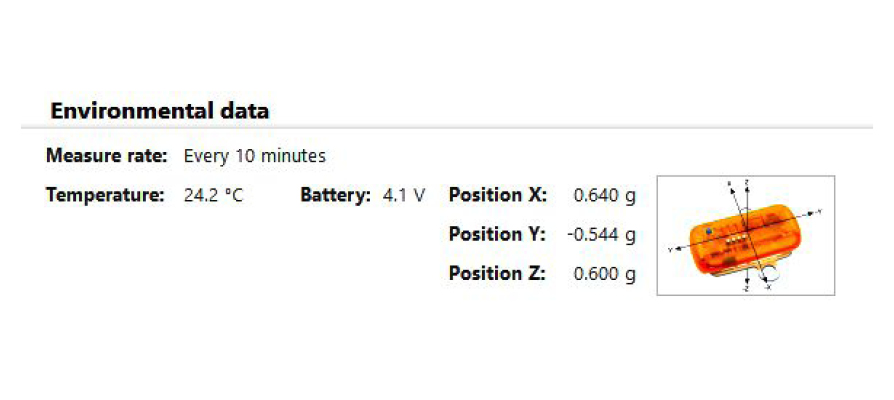
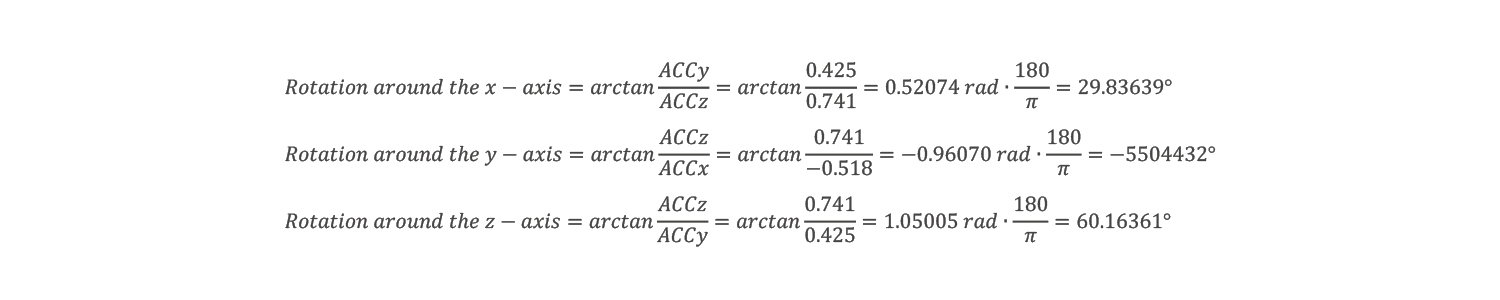
In the setup with «Read» on the MSR145 / MSR165 or «Click here to view values» on the MSR175 and MSR175plus, the current values ACCx, ACCy, ACCz can be read.
Housing types: Outlines, hole patterns, screw connections
| HOUSING TYPES | OUTLINES, HOLE PATTERNS | SCREW CONNECTIONS |
|---|---|---|
MSR165 B7/B8 |
 |
Thread assembly: e.g. DIN 965A / ISO 7046 A2 M3x8 Tightening torque: 0.45-0.55 NmMounting in wood and sheet metal: e.g. DIN 7983C / ISO 7051 A2 2.9×19 Tightening torque: 0.4-0.5 Nm |
MSR175 B16 |
 |
Thread assembly: e.g. DIN 7085A / ISO 7045 A2 M6x12 Tightening torque: 4.5-5.0 Nm
Mounting in wood and sheet metal: e.g, DIN 7981C / ISO 7049 A2 5.5×19 |
| MSR165 B52
|
 |
Thread assembly: e.g. DIN 7085A / ISO 7045 A2 M4x10 Tightening torque: 1.2-1.4 Nm
Mounting in wood and sheet metal: e.g. DIN 7981C / ISO 7049 A2 5.5×19
|
MSR175 B54 |
 |
Thread assembly: e.g. DIN 7085A / ISO 7045 A2 M4x10 Tightening torque: 1.2-1.4 Nm
Mounting in wood and sheet metal: e.g. DIN 7981C / ISO 7049 A2 5.5×19 |
MSR175plus B56 1) |
 |
Thread assembly: e.g. DIN 965A / ISO 7046 A2 M4x12 Tightening torque: 1.2-1.4 NmMounting in wood and sheet metal: e.g. DIN 7983C / ISO 7051 A2 3.5×19 Tightening torque: 1.0-1.2 Nm |

1) The GPS antenna of data logger MSR175plus, housing type B56 should be attached to the outside of the packaging. The back of the antenna is magnetic. On a non-magnetic body it can be positioned and secured with a wrapping foil.